3.3 Graphing
The speed of a moving object is defined as the comparison of how far it went to how much time elapsed. Mathematically, a comparison is division.
Therefore : v = Δd/t
This is one useful way to describe how something moves. Another way to describe it would be with a position vs. time graph. To create the graph, one needs to know an object’s positions at given instances of time. One plots these points on two axes, position being the vertical axis and time the horizontal.
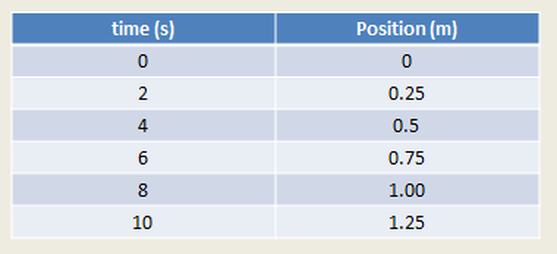
As an example, what would the graph of the motion of a toy car going across the floor look like? Let’s assume that the car starts at position = 0.0 m and you measure how far it is from the starting point every 2.0 s. After measuring for 10 seconds, you get the following data.
Therefore : v = Δd/t
This is one useful way to describe how something moves. Another way to describe it would be with a position vs. time graph. To create the graph, one needs to know an object’s positions at given instances of time. One plots these points on two axes, position being the vertical axis and time the horizontal.
As an example, what would the graph of the motion of a toy car going across the floor look like? Let’s assume that the car starts at position = 0.0 m and you measure how far it is from the starting point every 2.0 s. After measuring for 10 seconds, you get the following data.
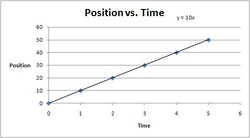
Graphing this data, you would get a straight line, like this:
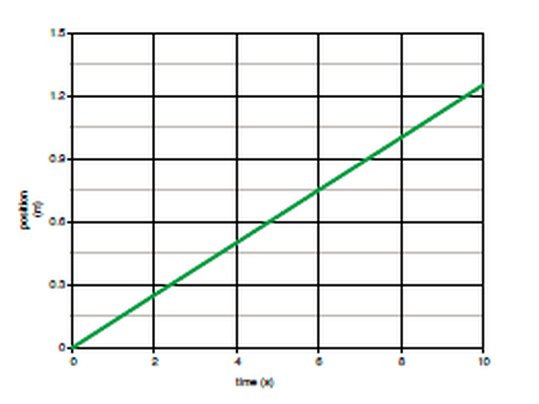
A straight line on a position vs. time graph tells you the object is going a constant speed. You can calculate the slope of the line by comparing the change in position to the change in time. A comparison of Δd and Δt is the speed. This means that the slope of the line on a position vs. time graph is the speed!
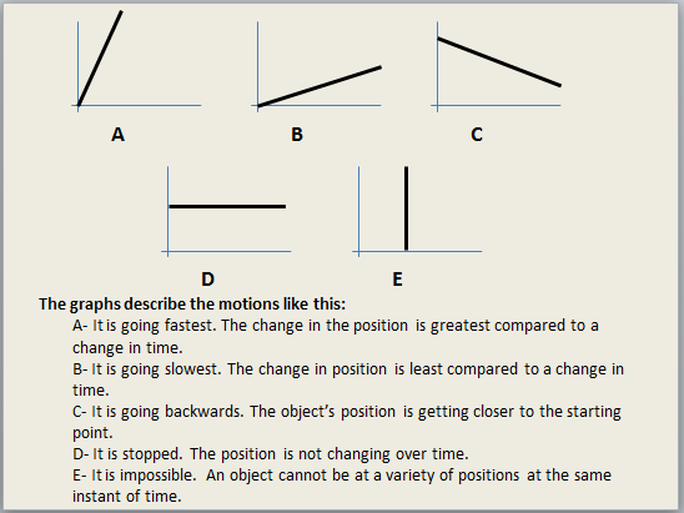
The slope of the line is a comparison of how the position changes to how the time changes. If the position of an object changes a lot in a short amount of time, we say the object is going fast. Its graph would have a steep slope. If there is a small change of position over a long period of time, the object is going slowly. Its graph would have a very shallow slope.
Take a look at the following position vs. time graphs.
3.3 Review Questions
| 3.3_review_questions.pdf |
